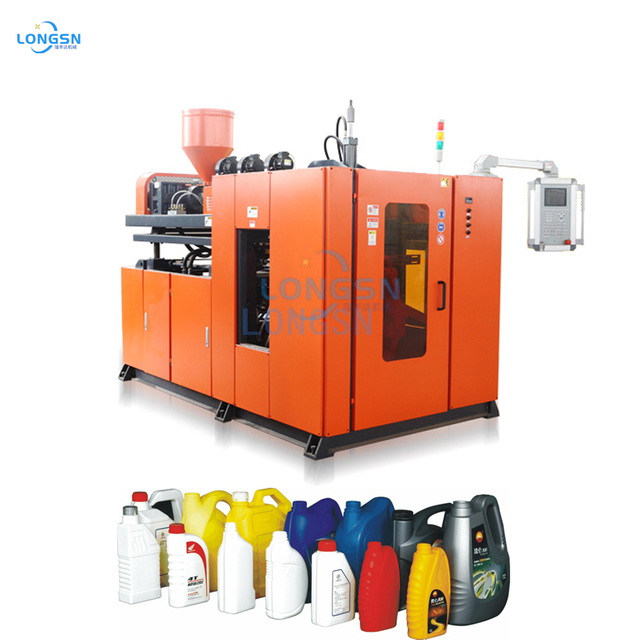
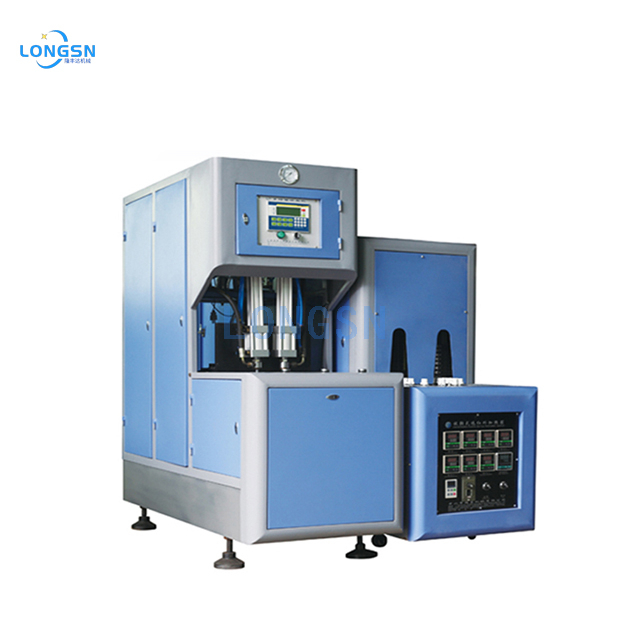
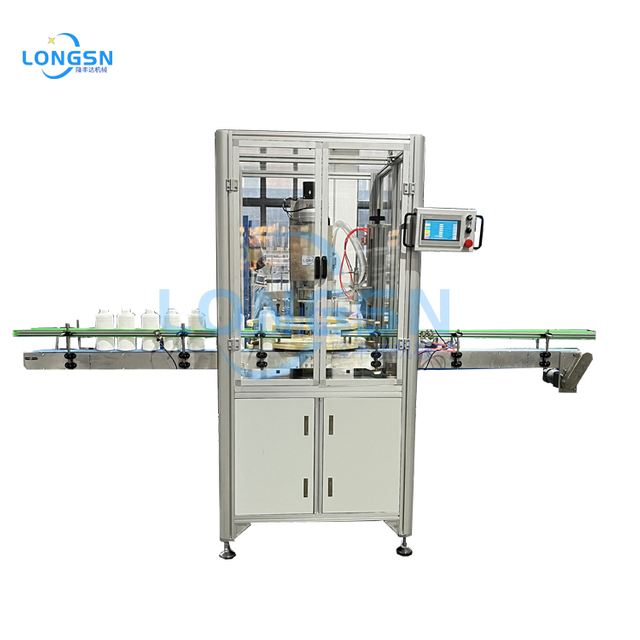
Procuring a plastic bottle blowing machine represents a high-stakes capital expenditure for any manufacturing facility. Initial price tags often obscure the true long-term financial commitment. Many buyers over-index on upfront machinery costs. In doing so, they underestimate ongoing operational expenditures. Hidden costs like energy draw, scrap rates, and unplanned downtime quickly erode profit margins. Ignoring these factors compromises your entire operational budget. This article provides an objective, evidence-based financial framework. We aim to help you calculate real production costs accurately. You will learn how to evaluate performance metrics directly against asking prices. Furthermore, we guide you in building a reliable return on investment model. By understanding the balance between initial capital and ongoing expenses, you can make smarter procurement decisions. Your facility will achieve better efficiency and sustained profitability over the equipment's lifespan.
Key Takeaways
- Upfront equipment costs typically represent only 30-40% of the lifetime cost of a plastic bottle blowing machine; energy and raw materials dictate the rest.
- Scaling from semi-automatic to fully automatic systems requires a minimum capacity utilization threshold to achieve a positive ROI.
- Investing in smart technologies (e.g., servo-driven systems, IoT diagnostics) can reduce long-term energy consumption by up to 30%, drastically lowering the Cost Per Bottle (CPB).
- Supplier evaluation must extend beyond the spec sheet to include Factory Acceptance Testing (FAT), local compliance (CE/FDA), and aftermarket service Level Agreements (SLAs).
The True Cost Breakdown: CapEx vs. OpEx Realities
Buyers often confuse the initial sticker price for the total required investment. These two figures represent vastly different financial commitments. Capital expenditures (CapEx) form your upfront outlay. Operational expenditures (OpEx) represent the ongoing costs to run the system daily.
Initial Capital Expenditures (CapEx)
Base machine prices vary based on several core factors. Cavity count dictates how many bottles produce per cycle. Production speed, measured in Bottles Per Hour (BPH), scales the price upwards. Drive mechanisms also impact the baseline cost significantly. Pneumatic systems generally cost less upfront. However, all-electric or servo-driven models demand a higher initial premium.
You must also account for ancillary equipment. A standalone machine cannot operate independently on a factory floor. Hidden CapEx requirements quickly add up. Essential peripheral equipment includes:
- High-pressure air compressors (typically 30-40 bar)
- Water chillers for precise mold temperature regulation
- Refrigerated air dryers to remove system moisture
- Customized PET preform molds tailored to your bottle design
Your facility also needs structural readiness. High-speed systems require specific power loads. You might need expensive electrical panel upgrades. Specialized piping for high-pressure air and cooling water is mandatory. Buyers must calculate these infrastructure upgrades before signing purchase orders.
Ongoing Operational Expenditures (OpEx)
Energy consumption profiles vary wildly among different equipment models. Legacy hydraulic or pneumatic machines consume massive amounts of power continually. Modern servo-electric models use kilowatt-hours (kWh) much more efficiently. They only draw significant power when actively moving components. This efficiency creates substantial monthly savings.
Material efficiency directly dictates your overall profit margins. Precision heating and stretching mechanics reduce raw material waste. A simple 1% reduction in scrap rate saves thousands of dollars annually. You can calculate this impact by multiplying your total annual resin cost by 0.01.
Labor and maintenance form the final OpEx pillar. Semi-automatic machines require constant manual operator intervention. Fully autonomous systems run steadily with minimal oversight. You must weigh operator wages against the machine’s autonomy levels. Furthermore, scheduled preventive maintenance remains predictable and affordable. Unplanned downtime, conversely, destroys profitability through lost production and rushed repair invoices.
Typical 5-Year Cost Distribution | Cost Category | Percentage of Lifecycle Cost | Primary Financial Drivers |
| CapEx (Initial Purchase) | 30% - 40% | Machine base price, molds, compressors, installation. |
| OpEx (Energy Consumption) | 25% - 35% | Local electricity rates, heating lamp efficiency, drive systems. |
| OpEx (Raw Materials) | 20% - 30% | PET preform costs, scrap rates, rejection percentages. |
| OpEx (Labor & Maintenance) | 10% - 15% | Operator wages, replacement parts, scheduled servicing. |

Economies of Scale: Matching Machine Capacity to Market Demand
Matching machine capacity precisely to market demand prevents massive financial waste. Buying maximum capacity carries a severe over-speccing risk. High-output systems sit idle without immediate market demand to support them. This scenario extends your return on investment timeline indefinitely. You end up paying for capability you do not use.
You must clearly understand your Cost Per Bottle (CPB). Use this foundational formula to evaluate operational efficiency: *(Total Fixed Costs + Total Variable Costs) / Total Yield*. Tracking this metric helps you pinpoint exact profitability thresholds.
Large-scale production unlocks incredible cost efficiencies when managed correctly. High-cavity, fully automated systems reduce unit labor costs dramatically. They spread fixed costs across a massive daily output volume. However, you only realize these financial gains at high utilization rates. Your machine must run at greater than 80% Overall Equipment Effectiveness (OEE). Dropping below this efficiency threshold erodes your profit margins rapidly.
Product design requirements also alter these financial dynamics. Multi-layer barrier bottles cost more to produce than standard single-layer containers. Sensitive liquids like carbonated beverages or juices demand these complex bottles. They require different material ratios and significantly longer cycle times. This complexity directly reduces your daily throughput and impacts overall profitability. You must factor these variable cycle times into your initial financial modeling.
Evaluating Smart Technology Upgrades: Are They Worth the Premium?
Many buyers view smart technology as an unnecessary luxury. We recommend evaluating premium features through strict cost-benefit analysis. Advanced technologies often pay for themselves rapidly through direct operational savings.
Servo-driven motors offer clear, mathematical justification for their higher price. They provide faster cycle times and exact mechanical positioning. More importantly, servo upgrades yield 20-30% energy savings over legacy pneumatic cams. You recoup the higher initial price entirely through consistently lower monthly power bills.
Industrial Internet of Things (IoT) sensors transform standard maintenance protocols. Real-time remote monitoring prevents catastrophic equipment failures before they happen. IoT diagnostics reduce scrap heavily during complex mold changeovers. They also lower your reliance on highly specialized, expensive in-house technicians. Technicians can diagnose minor faults remotely through cloud dashboards.
Automated scrap recovery systems provide another strong financial advantage. These systems immediately recapture and reprocess defective PET materials. They stabilize your variable material costs over long production runs. Recapturing waste prevents valuable resin from hitting the dumpster. This sustainability feature directly protects your bottom line.
Implementation Risks and Compliance Considerations
Prolonged installation phases carry severe financial penalties for manufacturers. Commissioning delays keep your equipment offline much longer than expected. Every lost production day erodes your projected return on investment. You must demand turnkey vendor support to mitigate this specific risk. The vendor should handle calibration and initial run testing efficiently.
Hidden costs also hide deeply within regulatory non-compliance. Local jurisdictions require specific safety and operational certifications. You must evaluate equipment for regional compliance standards like CE or UL. Food-grade applications strictly require FDA compliance for safe consumer packaging. Failing to meet these standards invites heavy regulatory fines. You might also face exorbitant post-purchase retrofitting costs to achieve compliance later.
Do not underestimate the operator training curve. New equipment often suffers from lower initial production yields. Operator unfamiliarity causes unnecessary errors, slower changeovers, and frequent machine jams. You must factor in structured vendor training programs early. Consider these professional training sessions a non-negotiable cost mitigation strategy. Proper training ensures your staff hits target BPH rates smoothly from day one.
Shortlisting Logic: A Framework for Vendor Evaluation
Choosing a reliable supplier requires structured evaluation frameworks. Relying solely on a marketing spec sheet is highly risky. Stated BPH numbers often reflect perfect, theoretical factory conditions. Focus instead on guaranteed, sustainable yield rates over standard 8-hour shifts.
We recommend following this four-step evaluation framework:
- Analyze Sustainable Yield: Request case studies showing actual factory performance over 30 days, rather than peak single-hour test runs.
- Verify Component Transparency: Look closely at the origin of valves, PLCs, and pneumatic cylinders. Ensure the machine uses standardized, globally available tier-1 components. This reduces long-term maintenance costs and simplifies future part sourcing.
- Mandate Factory Acceptance Testing (FAT): Establish strict performance benchmarks upfront. The vendor must meet these metrics at their facility first. They must use your specific preforms and molds during testing. Do not release the final payment until this test succeeds.
- Review After-Sales SLAs: Evaluate the aftermarket Service Level Agreements strictly. Review the exact pricing of common OEM replacement parts. Demand guaranteed response times for emergency technical support.
Following this logic removes emotion from the purchasing process. It forces vendors to prove their machine's value using tangible data. Your procurement team gains leverage during final contract negotiations.
Conclusion
Investing in an industrial plastic bottle blowing machine requires deep financial foresight. You must constantly balance upfront capital against long-term operational efficiency. Remember that the cheapest machine often yields the most expensive bottle over time. Prioritize overall lifecycle costs and OEE metrics over the initial sticker price.
Building a highly efficient production line requires moving beyond basic specifications. You must factor in energy efficiency, scrap reduction, and preventative maintenance protocols. We encourage you to move confidently from initial research to structured evaluation. Request a custom lifecycle cost analysis from your shortlisted vendors today. Download a comprehensive CapEx vs. OpEx calculator to run your own facility numbers. Finally, schedule a technical consultation to secure your production future safely and profitably.
FAQ
Q: What is the average payback period (ROI) for an industrial plastic bottle blowing machine?
A: The payback period depends heavily on capacity utilization and local labor or energy costs. However, it typically ranges from 18 to 36 months for well-optimized operations running multiple daily shifts.
Q: How much floor space and infrastructure is actually required?
A: You must address the footprint of the main machine plus essential peripherals like air compressors and chillers. Always include necessary physical clearances for safe maintenance access and local safety compliance regulations.
Q: Is it more cost-effective to buy semi-automatic or fully automatic equipment?
A: Semi-automatic models lower your initial CapEx but scale poorly due to higher labor costs and inconsistent cycle times. Fully automatic equipment is financially superior for production volumes exceeding 2,000 BPH.
Q: What are the primary maintenance costs to anticipate annually?
A: Anticipate replacing standard consumables like high-pressure seals, air filters, and infrared heating lamps. You should also budget for periodic servicing of high-pressure air systems. Generally, estimate these costs at 2-5% of the machine's initial purchase price per year.

 English